flowchart TD
    User((User))
    AIOps["AIOps Platform"]
    IdP["IdP"]
    LDAP[("LDAP Server")]

    subgraph "Authorization Flow"
    User -->|"(1) Access UI"| AIOps
    AIOps -.->|"(2) Redirect for Auth"| IdP
    IdP <-->|"(3) Verify Creds and Fetch Groups"| LDAP
    IdP == "(4) SAML Token (User + Groups)" ==> AIOps
    end

    style AIOps fill:#14164a,stroke:#333,stroke-width:2px
    style LDAP fill:#eee,stroke:#333,stroke-width:2px

    linkStyle 3 stroke-width:4px,fill:none,stroke:green;
AIOps on Linux Configuration
Configuring LDAPS Trust in AIOps
To enable a secure connection (LDAPS) between AIOps and an external LDAP server, you must import the LDAP server’s Certificate Authority (CA) certificate into the platform’s truststore.
Architecture Patterns
Before applying the configuration, it is important to understand why this certificate is needed. There are two common patterns for integrating LDAP with AIOps using SAML.
Option 1: The “Broker” Approach
In this model, the IdP handles all LDAP communication. AIOps learns about user and group data through SAML login attempts.
- Certificate Requirement: The LDAP CA is in the IdP connection to LDAP, not AIOps.
- AIOps Config: No LDAP connection required in AIOps.
| Pros | Cons |
|---|---|
| Simpler Config: AIOps needs no knowledge of LDAP topology. | Role Management: AIOps must first wait to be told about a group from a failed SAML login, then that group can be assigned a role. |
| Single Trust Store: Only the IdP needs the LDAP certificates. |
Option 2: The “Direct Dependency” Approach
In this model, AIOps uses SAML for authentication but connects directly to LDAP to search for user groups and details. The instructions in this document apply to this scenario.
- Certificate Requirement: You must import the LDAP CA into AIOps.
- AIOps Config: Requires an LDAP connection profile in AIOps.
flowchart TD
    User((User))
    AIOps["AIOps Platform"]
    IdP["IdP"]
    LDAP[("LDAP Server")]

    subgraph "Authorization Flow"
    User -->|"(1) Access UI"| AIOps
    AIOps -.->|"(2) Redirect for Auth"| IdP
    IdP <-->|"(3) Verify Creds Only"| LDAP
    IdP == "(4) SAML Token (User Only)" ==> AIOps
    AIOps <-->|"(5) Direct Query: Get User Groups"| LDAP
    end

    style AIOps fill:#f9f,stroke:#333,stroke-width:2px
    style LDAP fill:#eee,stroke:#333,stroke-width:2px

    linkStyle 3 stroke-width:4px,fill:none,stroke:green;
    linkStyle 4 stroke-width:4px,fill:none,stroke:red;
| Pros | Cons |
|---|---|
| Role Management: You can manage all the roles of LDAP users and groups inside the AIOps console immediately. | Complexity: Requires configuring LDAP in two places (IdP and AIOps). |
| Network: AIOps requires direct firewall access to the LDAP server. |
Prerequisites
- Access:
kubectlaccess to the cluster. - Certificate: The CA certificate file (e.g.,
ca.crt) that signed your LDAP server’s certificate.- Note: This must be the Root CA of the LDAP server, not an ingress certificate or a client certificate.
Procedure
1. Encode the Certificate
The certificate must be converted to a single-line Base64 string to be stored in a Kubernetes Secret.
Run the following command on your infrastructure node (Linux):
# Replace 'ca.crt' with your actual filename
cat ca.crt | base64 -w 0
Tip
Mac Users: If you are running this on macOS, use cat ca.crt | base64 (omit the -w 0).
Copy the output string to your clipboard. It will look like a long random string (e.g., LS0tLS1CRUdJTi...).
2. Edit the AIOps Trust Secret
AIOps uses a specific secret named platform-auth-ldaps-ca-cert to store trusted LDAP certificates.
Open the secret for editing:
kubectl edit secret platform-auth-ldaps-ca-cert -n aiopsLocate the
datasection.Find the key named
certificate.- If the key exists: Replace the existing value.
- If the key is empty/missing: Add
certificate:followed by your string.
It should look like this:
apiVersion: v1
data:
  certificate: <PASTE_YOUR_BASE64_STRING_HERE>
kind: Secret
metadata:
  name: platform-auth-ldaps-ca-cert
  namespace: aiops
type: Opaque
Save and exit the editor (usually
Escthen:wqif using vi).
3. Restart the Authentication Service
The authentication pods do not automatically reload the secret. You must restart them to pick up the new certificate.
kubectl delete pod -l component=platform-auth-service -n aiopsWait for the pods to come back up to the Running state:
kubectl get pods -l component=platform-auth-service -n aiops -w4. Verify Connectivity
Once the pods are running, you can test the connection via the AIOps Console or by checking the logs.
To check the logs for successful connection attempts:
kubectl logs -n aiops -l app=platform-identity-provider -fTroubleshooting Common Errors
| Log Error | Probable Cause |
|---|---|
ETIMEDOUT |
Firewall / Network: The pod cannot reach the LDAP IP on port 636. |
Handshake failed |
Certificate: The CA cert in the secret is wrong or expired. |
PKIX path building failed |
Trust: The server provided a cert that the secret’s CA does not sign. |
Configuring AIOps with Keycloak SAML
Overview
This documentation outlines the configuration of SAML authentication for IBM Cloud Pak for AIOps on Linux (k3s) using Keycloak as the Identity Provider (IdP). This setup does not use LDAP; users are managed directly within Keycloak and authorized via Groups in AIOps.
Prerequisites
- AIOps Platform: IBM Cloud Pak for AIOps running on Linux (k3s environment).
- Keycloak: Version 26.4.7 or later installed.
- Credentials:
- Keycloak Default Admin:
admin/admin - AIOps Administrator:
cpadmin
- Keycloak Default Admin:
Keycloak Initial Configuration
Login and Realm Creation
- Log in to the Keycloak Admin Console using the default credentials (
admin/admin). - Open the Manage realms menu on the top-left sidebar.
- Click the Create realm button.
- Enter the Realm name:
AIOpsRealm. - Click Create.
NoteWhy create a new Realm?
We create a dedicated realm rather than using Master to isolate the AIOps application data. A realm manages a set of users, credentials, roles, and groups. Using a separate realm ensures that application-specific configurations do not impact the administrative Master realm.
Create a Sample User
- Ensure you are in the
AIOpsRealm. - Click Users in the left menu.
- Click Create new user.
- Fill in the details:
- Username:
aiops-test-user - Email:
aiops-test@example.com - First Name:
AIOps - Last Name:
Tester - Email Verified: Toggle to Yes.
- Username:
- Click Create.
- Click the Credentials tab at the top of the user profile.
- Click Set Password.
- Enter a password (e.g.,
Password123!), toggle Temporary to Off, and click Save.
Create a Group
- Click the Groups menu on the left sidebar.
- Click Create group.
- Enter the name:
aiops-analysts. - Click Create.
- Navigate back to Users (left menu) and select
aiops-test-user. - Click the Groups tab.
- Click Join Group, select
aiops-analysts, and click Join.
SAML Configuration Handshake
Configuring SAML requires a specific “handshake”: starting in AIOps to get the Service Provider metadata, moving to Keycloak to create the client, and finishing in AIOps with the IdP metadata.
Step 1: Start AIOps Configuration (Download SP Metadata)
- Log in to the AIOps Console as
cpadmin. - Navigate to Administration > Access Control.
- Click Identity Providers.
- Click New Connection > SAML 2.0.
- Enter the Connection Name:
KeycloakSAML. - Stop here. Do not close this window.
- Locate the section titled To identity provider.
- Click the Download metadata button.
- This saves a file named
metadata.xml. Keep this file accessible.
Step 2: Configure Keycloak Client (Import SP Metadata)
- Return to the Keycloak Admin Console (
AIOpsRealm). - Click Clients in the left menu.
- Click Import client.
- Click Browse and select the
metadata.xmlfile you downloaded from AIOps. - Keycloak will parse the file.
- Client type: Ensure this is
SAML. - Client ID: This will be a long URL (e.g.,
https://<host>/idauth/ibm/saml20/defaultSP). Do not change this; it must match the Entity ID expected by AIOps. - Name: This will be blank. Enter
AIOpsto make it easier to find in the list later.
- Client type: Ensure this is
- Click Save.
Step 3: Configure Client Settings (NameID)
AIOps maps Sub (Subject) to nameID by default. You do not need a mapper for this, but you must tell Keycloak to send the Username as the Subject in the standard SAML header.
- In the Client details screen (Settings tab) for the new
AIOpsclient: - Scroll down to the SAML capabilities or Signature and Encryption section.
- Ensure Sign documents is toggled On.
- Scroll to the Login settings (or Advanced settings depending on Keycloak version).
- Find Name ID Format. Set this to
username.- Note: This ensures that the
<Subject>field in the SAML assertion contains theaiops-test-userusername, which AIOps will map toSub.
- Note: This ensures that the
- Toggle Force Name ID Format to On.
- Click Save.
Step 4: Configure Token Mappers in Keycloak
AIOps expects specific attribute names by default (firstName, lastName, emailAddress, blueGroups). We must map Keycloak values to these exact names.
Click the Client scopes tab within the
AIOpsclient details.Click the
*-dedicatedscope (e.g.,...-dedicated).Add the Mappers:
- First Name:
- Click Configure a new mapper (or Add mapper > By configuration).
- Select User Property.
- Name:
givenName mapping - Property:
firstName - SAML Attribute Name:
firstName - Click Save.
- Last Name:
- Click Add mapper > By configuration > User Property.
- Name:
familyName mapping - Property:
lastName - SAML Attribute Name:
lastName - Click Save.
- Email:
- Click Add mapper > By configuration > User Property.
- Name:
email mapping - Property:
email - SAML Attribute Name:
emailAddress - Click Save.
- Groups:
- Click Add mapper > By configuration > Group list.
- Name:
group mapping - SAML Attribute Name:
blueGroups - Full group path: Off (To send
aiops-analystsinstead of/aiops-analysts). - Click Save.
- First Name:
Step 5: Export Keycloak IdP Metadata
- In Keycloak, go to Realm Settings (left menu).
- Under the General tab, scroll down to the Endpoints (or SAML Metadata) section.
- Click SAML 2.0 Identity Provider Metadata.
- This will open the XML in a new browser tab. Save this page as
keycloak-idp-metadata.xml.
Step 6: Finish AIOps Configuration (Upload IdP Metadata)
- Return to the AIOps Console wizard (where you left off in Step 1).
- Scroll to the section titled From identity provider.
- Upload the
keycloak-idp-metadata.xmlfile you just saved. - Review the Token attribute mapping section. It should display the defaults:
- Sub:
nameID(Matches the “Name ID Format: username” setting in Keycloak). - Given Name:
firstName(Matches our mapper). - Family name:
lastName(Matches our mapper). - Groups:
blueGroups(Matches our mapper). - Email:
emailAddress(Matches our mapper).
- Sub:
- Click Create (or Save).
Configuring Group Access (API Workaround)
Because the Foundational Services layer on k3s does not always automatically populate SAML groups in the UI, we must manually create a User Group using the internal API and map the Keycloak group to it.
Perform the following steps on your Linux terminal where you have kubectl access to the cluster.
1. Set Environment Variables
Define the Ingress hosts for your environment. Ensure these URLs are resolvable from your terminal.
# Example hosts - update these to match your specific k3s ingress routes
export ZENHOST=https://aiops-cpd.aiops-haproxy.gym.lan
export CPHOST=https://cp-console-aiops.aiops-haproxy.gym.lan
2. Retrieve Credentials and Generate Tokens
We need to retrieve the cpadmin password from the Kubernetes secret and use it to generate two tokens: an IAM token and a Zen token.
# Get credentials using kubectl
export USERNAME=`kubectl get secret platform-auth-idp-credentials -n aiops -o json | jq -r .data.admin_username| base64 -d`
export PASSWORD=`kubectl get secret platform-auth-idp-credentials -n aiops -o json | jq -r .data.admin_password| base64 -d`

# Generate IAM Token
IAM_TOKEN=$(curl -k -X POST -H "Content-Type: application/x-www-form-urlencoded;charset=UTF-8" -d "grant_type=password&username=${USERNAME}&password=${PASSWORD}&scope=openid" "${CPHOST}/idprovider/v1/auth/identitytoken" 2> /dev/null | jq -r ".access_token")

# Generate Zen Token
ZENTOKEN=$(curl -k -X GET "${ZENHOST}/v1/preauth/validateAuth" --header "username: ${USERNAME}" --header "iam-token: ${IAM_TOKEN}" 2> /dev/null | jq -r '.accessToken')
3. Identify the Desired Role
AIOps has specific internal role IDs. Run this command to see the available roles and their IDs.
curl -k -H "Authorization: Bearer $ZENTOKEN" -X GET $ZENHOST/usermgmt/v1/roles | jq -r '.rows[] | [ .doc.role_name, .doc._id ] | @csv ' | sed -e 's/,/|/g' -e 's/\"//g'Common Output:
Automation Analyst|iaf-automation-analyst
Automation Developer|iaf-automation-developer
User|zen_user_role
Administrator|zen_administrator_role
Automation Administrator|iaf-automation-admin
For this guide, we will use iaf-automation-analyst to give our group Analyst permissions.
4. Create the Internal Group
We will create a group inside AIOps named “AIOps Analysts” and assign it the Automation Analyst role.
# Create the group and capture the output to find the new ID
curl -k -s -X POST "${ZENHOST}/usermgmt/v2/groups" \
  --header 'Content-Type: application/json' \
  --header 'Accept: application/json' \
  --header "Authorization: Bearer ${ZENTOKEN}" \
  -d '{"name": "AIOps Analysts", "description": "Mapped SAML Group", "role_identifiers": ["iaf-automation-analyst"]}' | jq .
Note the id in the output. (Example: 10001).
5. Map the Keycloak Group to the Internal Group
Finally, we map the string aiops-analysts (which Keycloak sends in the blueGroups attribute) to the internal group ID we just created (e.g., 10001).
Replace 10001 in the URL below with the actual ID returned in the previous step.
curl -k -s -X POST "${ZENHOST}/usermgmt/v2/groups/10001/members" \
  --header 'Content-Type: application/json' \
  --header 'Accept: application/json' \
  --header "Authorization: Bearer ${ZENTOKEN}" \
  -d '{"idp_groups": ["aiops-analysts"]}'
Verification
Now that the group mapping is established via the API, the user should have immediate access upon login.
- Open a Private/Incognito browser window.
- Navigate to the AIOps Console URL.
- Select Enterprise SAML (or
KeycloakSAML) from the login screen. - Redirect to Keycloak -> Log in as
aiops-test-user. - Success: You should be redirected back to the AIOps console and successfully logged in. The user will have the permissions defined by the Automation Analyst role.
Self Monitoring
Setting Up a Promethues AlertManager Webhook in AIOps
1. Define the Webhook in the AIOps UI
- Navigate to Integrations in the AIOps console and select Add integration.
- Under the Events category, select Prometheus AlertManager, click Get started.
- Provide a Name (e.g. Prometheus) and optional description for the webhook to identify its purpose (e.g., Prometheus Alerts (Self Monitoring)).
- Select None for Authentication type and click Next.
2. Map Prometheus Alert JSON to AIOps Schema
- In the webhook configuration screen, locate the Mapping section.
- Use the following JSONata mapping:
(
    /* Set resource based on labels available */
    $resource := function($labels){(
      $name := $labels.name ? $labels.name
        : $labels.node_name ? $labels.node_name
        : $labels.statefulset ? $labels.statefulset
        : $labels.deployment ? $labels.deployment
        : $labels.daemonset ? $labels.daemonset
        : $labels.pod ? $labels.pod
        : $labels.container ? $labels.container
        : $labels.instance ? $labels.instance
        : $labels.app ? $labels.app
        : $labels.job_name ? $labels.job_name
        : $labels.job ? $labels.job
        : $labels.type ? $labels.type: $labels.prometheus;

      /* Conditional Namespace Append */
      $namespace_appended := $labels.namespace ? ($name & '/' & $labels.namespace) : $name;

      /* Check if the determined $name is likely a node/hardware name */
      $is_node_alert := $labels.node_name or $labels.instance;

      $is_node_alert ? $name : $namespace_appended; /* Only append if NOT a node alert */
    )};
    /* Map to event schema */
    alerts.(
      {
        "summary": annotations.summary ? annotations.summary: annotations.description ? annotations.description : annotations.message ? annotations.message,
        "severity": $lowercase(labels.severity) = "critical" ? 6 : $lowercase(labels.severity) = "major" ? 5 : $lowercase(labels.severity) = "minor" ? 4 : $lowercase(labels.severity) = "warning" ? 3 : 1,
        "resource": {
          "name": $resource(labels)
        },
        "type": {
          "eventType": $lowercase(status) = "firing" ? "problem": "resolution",
          "classification": labels.alertname
        },
        "links": [
          {
              "url": generatorURL
          }
        ],
        "sender": {
          "name": "Prometheus",
          "type": "Webhook Connector"
        },
       "details": labels
      }
    )
)- Click Save.
3. Generate the Webhook and Capture the URL
- The webhook will start initializing, wait as it intializes.
- A unique Webhook route will be displayed (e.g.,
https://<aiops-domain>/webhook-connector/<id>) once the webhook is Running. - Copy this URL — it will be used in the AlertmanagerConfig in Prometheus to send alerts to AIOps.
Prometheus Alertmanager: Webhook Receiver Configuration for AIOps
This section outlines the steps required to configure the Prometheus Operator’s Alertmanager to successfully send alerts to the AIOps webhook endpoint.
The process involves two main phases:
- Network Configuration: Ensuring the webhook FQDN is resolvable within the cluster.
- Alerting Configuration: Defining the Alertmanager receiver and routing.
1. Network Configuration (DNS Resolution)
The Alertmanager pod must be able to resolve the AIOps webhook FQDN (e.g. whconn-d59baea5-a620-4efd-bfdc-bbbce5314530-aiops.aiops-haproxy.gym.lan). Since this FQDN is custom and resolves to a specific HAProxy IP (192.168.252.9), the entry must be added to CoreDNS.
Update the coredns-custom ConfigMap
Edit the coredns-custom ConfigMap in the kube-system namespace to include the webhook domain, mapping it to your HAProxy IP (192.168.252.9). This approach is necessary since standard Kubernetes DNS does not resolve external domains.
Note: Replace 192.168.252.9 with your actual HAProxy IP if different. Replace <webhook route> with the fqdn from the webhook route generated by AIOps (e.g. whconn-d59baea5-a620-4efd-bfdc-bbbce5314530-aiops.aiops-haproxy.gym.lan)
Additional Note: The below ConfigMap also contains additional DNS mapping to the CloudPak console and the AIOPs UI. This may or may not be applicable to your environment.
kubectl apply -f - <<EOF
apiVersion: v1
kind: ConfigMap
metadata:
  name: coredns-custom
  namespace: kube-system
apiVersion: v1
data:
  default.server: |
    cp-console-aiops.aiops-haproxy.gym.lan {
        hosts {
              192.168.252.9 cp-console-aiops.aiops-haproxy.gym.lan
              fallthrough
        }
    }
    aiops-cpd.aiops-haproxy.gym.lan {
        hosts {
              192.168.252.9 aiops-cpd.aiops-haproxy.gym.lan
              fallthrough
        }
    }
    <webhook route> {
        hosts {
              192.168.252.9 <webhook route>
              fallthrough
        }
    }
EOF
Restart CoreDNS
Force CoreDNS to reload the new ConfigMap by restarting the deployment:
kubectl -n kube-system rollout restart deployment corednsAfter CoreDNS restarts, the Alertmanager will be able to resolve the hostname, and all firing alerts will successfully flow to your AIOps webhook.
2. Configure Alertmanager Receiver
Since the Prometheus Operator uses the AlertmanagerConfig Custom Resource (CRD), we define the webhook receiver and routing within this resource.
Define the AlertmanagerConfig CR
Create or update the AlertmanagerConfig CR (named aiops-webhook-receiver in this example) to include the receiver and routing.
Replace the sample webhook route https://whconn-d59baea5-a620-4efd-bfdc-bbbce5314530-aiops.aiops-haproxy.gym.lan/webhook-connector/fj3u0bq23tk with your actual webhook route and save to a file named aiops-alertmanagerconfig.yaml.
apiVersion: monitoring.coreos.com/v1alpha1
kind: AlertmanagerConfig
metadata:
  name: aiops-webhook-receiver
  namespace: prometheus-operator # Must be in the same namespace as Alertmanager
  labels:
    alertmanagerConfig: main # Must match your Alertmanager CR selector
spec:
  # 1. Define the Receiver
  receivers:
  - name: 'aiops-webhook-receiver'
    webhookConfigs:
      - url: 'https://whconn-d59baea5-a620-4efd-bfdc-bbbce5314530-aiops.aiops-haproxy.gym.lan/webhook-connector/fj3u0bq23tk' # REPLACE
        sendResolved: true
        # Required for self-signed certificates
        httpConfig:
          tlsConfig:
            insecureSkipVerify: true

  # 2. Define the Route
  route:
    receiver: 'aiops-webhook-receiver' # Route all alerts to the new receiver
    groupBy: ['alertname', 'severity']
    groupWait: 30s
    groupInterval: 5m
    repeatInterval: 4h
Apply the Configuration
Apply the manifest:
kubectl apply -f aiops-alertmanagerconfig.yaml3. Alert Lifecycle
This section assumes that you have created a rule in Prometheus to trigger an alert if an AIOps node root filesystem / usage exceeds 90%.
Trigger Storage Alert
Use the following script trigger_disk_alert.sh to trigger a storage alert on the root fileystem of an AIOps node.
#!/bin/bash

# Configuration
TARGET_PERCENT=90
MOUNT_POINT="/"
SAFETY_BUFFER_MB=10 # Add 10MB buffer to ensure we pass the threshold
TARGET_FILE="/tmp/ROOT_FILL_FILE.bin"

echo "--- Disk Usage Alert Trigger ---"

# 1. Get disk statistics for the root filesystem in Kilobytes (KB)
# Uses df -k to get output in KB for precise calculation
if ! STATS=$(df -k "${MOUNT_POINT}" 2>/dev/null | awk 'NR==2{print $2, $3}'); then
    echo "Error: Failed to get disk statistics for ${MOUNT_POINT}. Exiting."
    exit 1
fi

TOTAL_KB=$(echo "$STATS" | awk '{print $1}')
USED_KB=$(echo "$STATS" | awk '{print $2}')
# AVAILABLE_KB is not strictly needed for the calculation, but useful for debugging

# Calculate percentages using integer arithmetic (multiplying by 100 first for precision)
CURRENT_PERCENT=$(( (USED_KB * 100) / TOTAL_KB ))

# Convert KB to MB for display purposes only
TOTAL_MB=$(( TOTAL_KB / 1024 ))
USED_MB=$(( USED_KB / 1024 ))

echo "Filesystem: ${MOUNT_POINT}"
echo "Total Size: ${TOTAL_MB} MB"
echo "Used Size:  ${USED_MB} MB (${CURRENT_PERCENT}%)"
echo "Target:     ${TARGET_PERCENT}% usage"

# 2. Check if the disk is already above the target
# Integer check: If (Current Used KB * 100) is >= (Total KB * Target Percent)
if [ $(( USED_KB * 100 )) -ge $(( TOTAL_KB * TARGET_PERCENT )) ]; then
    echo "Current usage (${CURRENT_PERCENT}%) is already above the target (${TARGET_PERCENT}%). No file created."
    exit 0
fi

# 3. Calculate the required KB to reach the target percentage
# T_target_KB = (TOTAL_KB * TARGET_PERCENT) / 100
TARGET_USAGE_KB=$(( (TOTAL_KB * TARGET_PERCENT) / 100 ))

# Calculate buffer size in KB
SAFETY_BUFFER_KB=$(( SAFETY_BUFFER_MB * 1024 ))

# Required KB = (Target KB - Current Used KB) + Safety Buffer KB
REQUIRED_KB=$(( TARGET_USAGE_KB - USED_KB + SAFETY_BUFFER_KB ))


# 4. Convert required KB to MB (dd count uses 1MB blocks) and round up
# Use shell arithmetic for simple rounding up: (KB + 1023) / 1024
REQUIRED_MB_COUNT=$(( (REQUIRED_KB + 1023) / 1024 ))

# 5. Execute dd command
echo "--------------------------------------"
echo "Creating file of size: ${REQUIRED_MB_COUNT} MB at ${TARGET_FILE}"
echo "This will push usage over ${TARGET_PERCENT}%..."

# Execute the dd command using the calculated count
# Note: Requires sudo access to write to the filesystem
sudo dd if=/dev/zero of="${TARGET_FILE}" bs=1M count="${REQUIRED_MB_COUNT}" 2>/dev/null

# 6. Final verification (Use awk to extract the percentage from df -h)
NEW_PERCENT=$(df -h "${MOUNT_POINT}" | awk 'NR==2{print $5}')
echo "Creation complete."
echo "New usage: ${NEW_PERCENT}"
echo "--------------------------------------"

exit 0
Run the script.
chmod +x trigger_disk_alert.sh && ./trigger_disk_alert.shSample output.
--- Disk Usage Alert Trigger ---
Filesystem: /
Total Size: 2916 MB
Used Size:  2041 MB (69%)
Target:     90% usage
--------------------------------------
Creating file of size: 594 MB at /tmp/ROOT_FILL_FILE.bin
This will push usage over 90%...
Creation complete.
New usage: 91%
--------------------------------------
Alert in Prometheus
Log in to Prometheus Explorer Alerts console with your AIOps credentials. The URL is https://aiops-cpd.<domain>/self-monitoring/explorer/alerts where <domain> is the network domain AIOps is installed on (e.g. https://aiops-cpd.aiops-haproxy.gym.lan/self-monitoring/explorer/alerts).
Within a few minutes you will see a NodeDiskUsage alert firing.
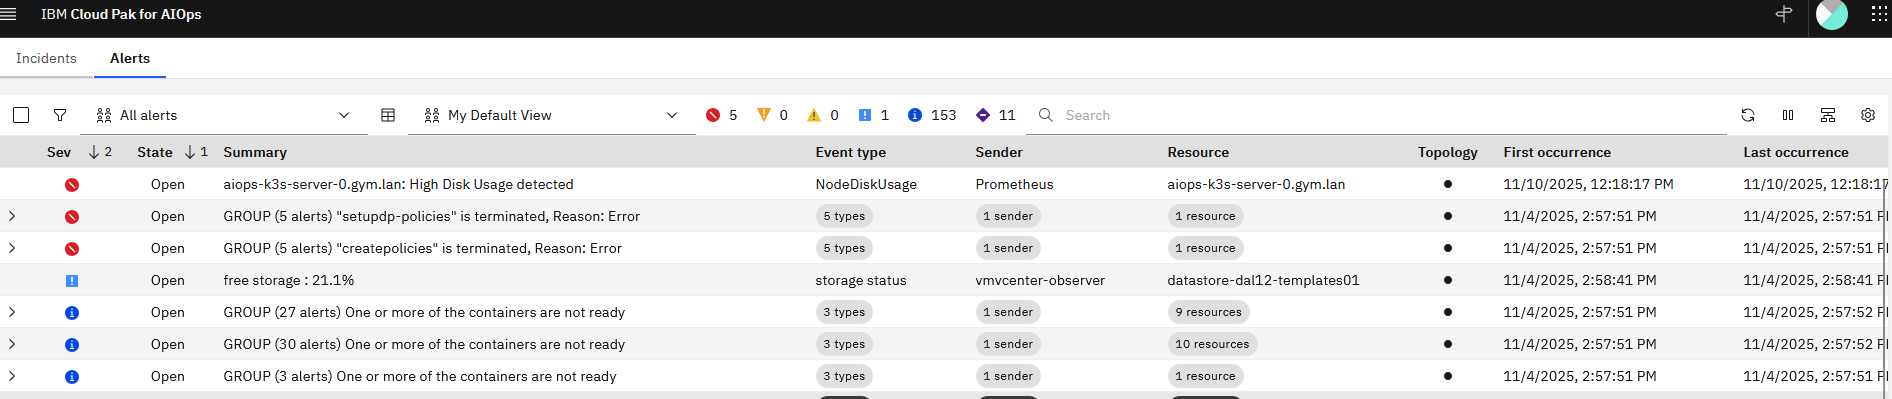
Alert in AIOps
In AIOps, navigate to the Alerts list. Here you will see the critical Prometheus alert for High Disk Usage.
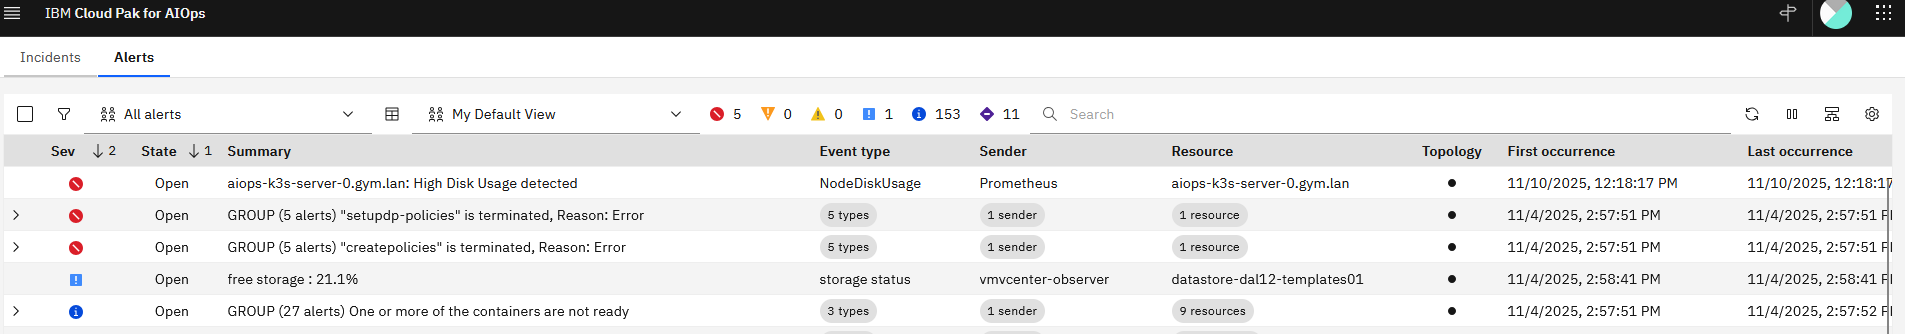
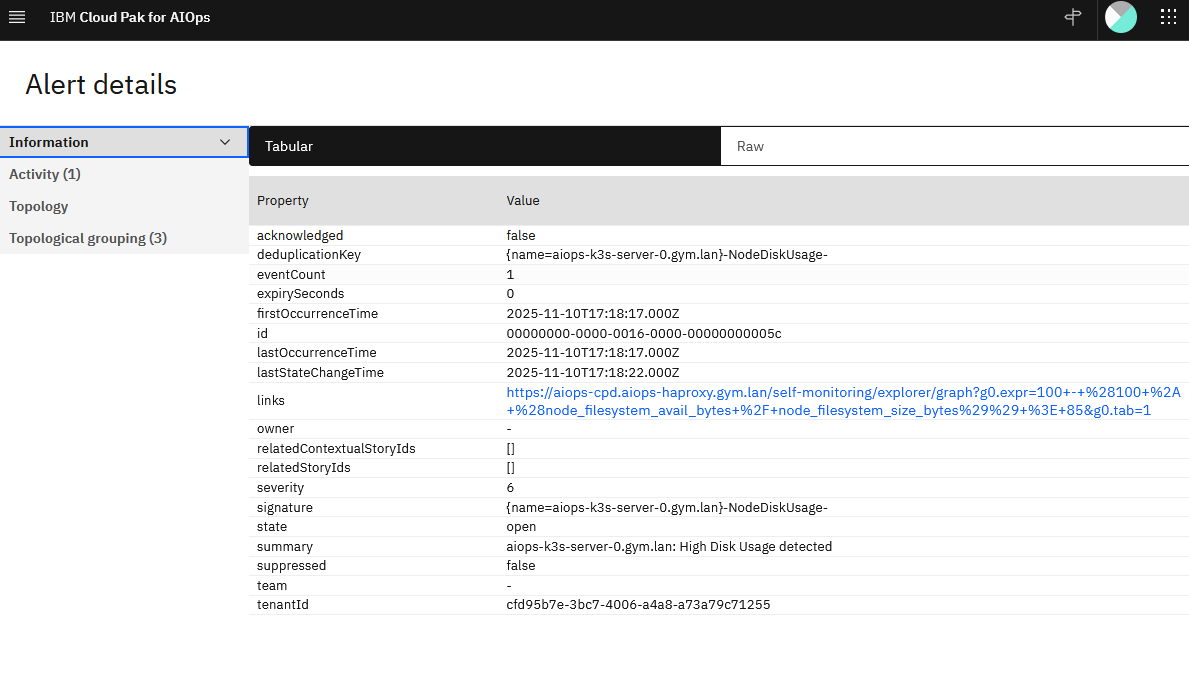
Double click on the alert to open the details.
Resolve Alert
On the same not where you triggered the disk usage script. Resolve the disk consumption by deleting the created file.
sudo rm -f /tmp/ROOT_FILL_FILE.binAfter a few minutes, Prometheus will clear the alert and the clear action will cascade to AIOps.
![]()