Usage
A lot of info cribbed from here
For a complete list of tested algorithms, see above link.
Executing the tests
Depending on where you extracted the PTH, change directory to the test_utils folder.
cd ~/perftest/pqc-performance-test/test_utilsRunning the h2load test suite
Run the test with the ip address you set as TARGET_IP_LIST. In our example we used 9.46.72.93. Select 11 to test all algorithms.
./all_h2load.sh -c 6 -n 100000 -s 9.46.72.93 -t 3 -o ~/perftest/perf_results/h2load

/root/perftest/perf_results/h2load exists and will be appended.
h2load performance tests with a variety of key agreement algorithms
Retrieving assignments ...
Staring h2load container ...
Running load test using 6 clients for 100000 requests.
Choose a signature algorithm or select 'all' to test all signatures:
1. ecdsap256
2. ecdsap384
3. ecdsap521
4. dilithium2
5. dilithium3
6. dilithium5
7. p256_dilithium2
8. p384_dilithium3
9. p521_dilithium5
10. rsa3072
11. all
0. Exit
Enter your choice (1-11): 11
The test should run for a little while. In our example case, the last lines returned were the following:
2024/07/31 11:14:45: 100000 total requests with 6 concurrent connections to https://9.46.72.93 from 10.21.71.145/cluster-nfs-nfs01.fyre.ibm.com.
Request Time: Time taken for a single request and response.
Connect Time: Time to connect to the server including TLS handshake.
First Byte Time: Time to get the first byte of decrypted application data from the server.
Running the openssl test suite
We’re testing against our docker host again (9.46.72.93). Select 11 for all algorithms.
./all_openssl.sh -t 30 -s 9.46.72.93 -w / -o ~/perftest/perf_results/openssl

openssl s_time performance tests with a variety of key agreement algorithms
Retrieving assignments ...
Starting PQC client container ...
Retrieving CA Certificate ...
Choose a signature algorithm or select 'all' to test all signatures:
1. ecdsap256
2. ecdsap384
3. ecdsap521
4. dilithium2
5. dilithium3
6. dilithium5
7. p256_dilithium2
8. p384_dilithium3
9. p521_dilithium5
10. rsa3072
11. all
0. Exit
The test should run for quite a while. In our example case, the last lines returned were the following:
2024/07/31 12:01:53: 30 seconds of requests to 9.46.72.93 from 10.21.71.145/cluster-nfs-nfs01.fyre.ibm.com using cipher TLS_AES_256_GCM_SHA384.
Total Reqeusts: Total number of connections initiaged (no session reuse).
User Time: User CPU time consumed durring test loop execution.
User Rate: Connections per user CPU second.
Real Time: Wall clock time of the s_time run rounded to integer seconds.
Total Bytes: Total number of payload bytes (actual web response) returned.
Generate the visualizations
Run ./gen_visulizations.sh
We’re going to use port 8080 for our example.
./gen_visulizations.sh
Enter infrastructure name: Test Infra
Enter the PTH Dashboard target port: 8080
[+] Building 17.5s (12/12) FINISHED                                                                                            docker:default
 => [internal] load build definition from Dockerfile                                                                                     0.1s
 => => transferring dockerfile: 895B                                                                                                     0.0s
 => [internal] load metadata for docker.io/library/node:alpine                                                                           0.8s
 => [auth] library/node:pull token for registry-1.docker.io                                                                              0.0s
 => [internal] load .dockerignore                                                                                                        0.1s
 => => transferring context: 2B                                                                                                          0.0s
 => [1/6] FROM docker.io/library/node:alpine@sha256:39005f06b2fae765764d6fdf20ad1c4d0890f5ad3e1f39b56a18768334b8ecd6                     6.9s
 => => resolve docker.io/library/node:alpine@sha256:39005f06b2fae765764d6fdf20ad1c4d0890f5ad3e1f39b56a18768334b8ecd6                     0.1s
 => => sha256:39005f06b2fae765764d6fdf20ad1c4d0890f5ad3e1f39b56a18768334b8ecd6 6.62kB / 6.62kB                                           0.0s
 => => sha256:c83e6e8aa2c458cf740b18b7b13e546751fe081d36223aac253b5ec0da2cd89d 1.72kB / 1.72kB                                           0.0s
 => => sha256:5c4cc5767575c711b99b1b077ad8afb8cfbf407aca174b7cbc998ce6db1e4f93 6.36kB / 6.36kB                                           0.0s
 => => sha256:c6a83fedfae6ed8a4f5f7cbb6a7b6f1c1ec3d86fea8cb9e5ba2e5e6673fde9f6 3.62MB / 3.62MB                                           0.3s
 => => sha256:c4f54159f74a5dccd97b9af978fab507483785736e822851638f20f275716fc3 1.39MB / 1.39MB                                           0.3s
 => => sha256:8d90f41c769e0bfd90a1e8456db9f590ae8dc42842ffa098693b6ed4bd44eba3 47.36MB / 47.36MB                                         1.0s
 => => extracting sha256:c6a83fedfae6ed8a4f5f7cbb6a7b6f1c1ec3d86fea8cb9e5ba2e5e6673fde9f6                                                0.4s
 => => sha256:6ecb2bd0d8e8f8628fe4a7cf14404c59d67a5547c6e5faa4a507f4b232bd316e 449B / 449B                                               0.4s
 => => extracting sha256:8d90f41c769e0bfd90a1e8456db9f590ae8dc42842ffa098693b6ed4bd44eba3                                                4.9s
 => => extracting sha256:c4f54159f74a5dccd97b9af978fab507483785736e822851638f20f275716fc3                                                0.1s
 => => extracting sha256:6ecb2bd0d8e8f8628fe4a7cf14404c59d67a5547c6e5faa4a507f4b232bd316e                                                0.0s
 => [internal] load build context                                                                                                        0.2s
 => => transferring context: 1.44MB                                                                                                      0.1s
 => [2/6] WORKDIR /app                                                                                                                   0.3s
 => [3/6] COPY dist/ /app/dist/                                                                                                          0.2s
 => [4/6] RUN npm install -g http-server@14.1.1                                                                                          6.9s
 => [5/6] RUN addgroup -S appuser && adduser -S appuser -G appuser                                                                       0.6s
 => [6/6] RUN chown -R appuser:appuser /app                                                                                              0.6s
 => exporting to image                                                                                                                   0.7s
 => => exporting layers                                                                                                                  0.6s
 => => writing image sha256:ce54effa6ab8dec6db3ddcee727d065728f5560907d0d6dddb90df5dbf874a2d                                             0.0s
 => => naming to docker.io/library/pth_dashboard                                                                                         0.0s
4b6dd6935d473d0f637fec4f81bf1df03f42a1656e16a4923cf38b5585308487
All output files are converted and stored. The script then builds and deploys the dashboard container
docker ps -a
CONTAINER ID IMAGE COMMAND CREATED STATUS PORTS NAMES
4b6dd6935d47 pth_dashboard "docker-entrypoint.s…" 39 seconds ago Up 38 seconds 0.0.0.0:8080->8080/tcp pthdashboard
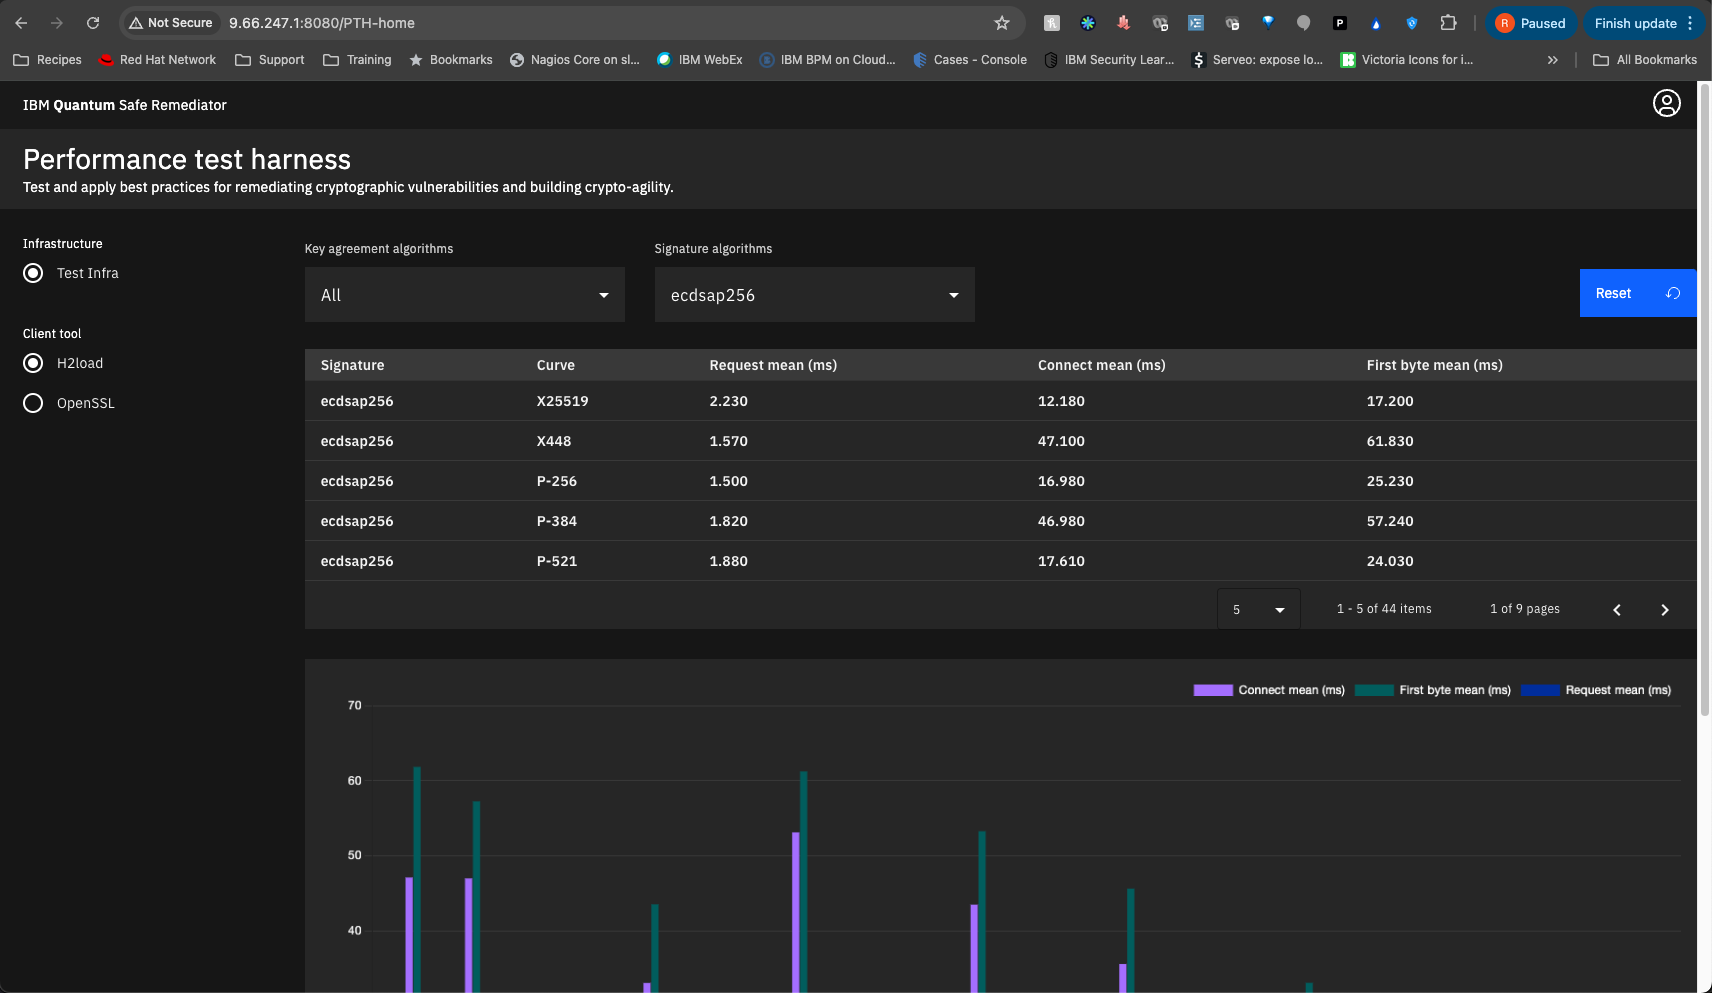
a7011b81d849 localhost:5000/qsc-perf-server-ubuntu:provider "/bin/bash /opt/ngin…" 2 hours ago Up 2 hours 0.0.0.0:9100-9563->9100-9563/tcp, 0.0.0.0:9080->80/tcp, 0.0.0.0:9043->443/tcp qsc-perf-serverIn our case, the dash can now be seen at port 8080 at our docker host